Friday, July 29, 2005

Moving Averages and Moving Average crossovers

A couple of approaches have been very commonly used in working with moving averages.

One is to trade in the direction of moving average crosses where a shorter term moving average (ma) cross a longer term one.

Unfortunately this leaves a trader open to whipsaws the majority of his trading career as most markets are not trending.

An easier and more profitable use of moving averages is to use them to enter into a trending market where one exists.

Its usually allows you to enter on a pullback (combine it with a relatively low or high $TICK for example) and to trade with tighter stops without them being raided continuously.

I will post a couple of charts here as examples. Moving averages allow you to take advantage of trends.

You can also reference my article on moving average fans for more information.
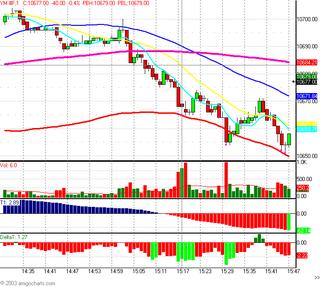

Above the price of the YM futures contract follows the 20 sma (yellow line)on a 1 minute chart - down to the lower bollinger band. Below it follows the 50 sma down on the 1 minute chart. Both examples are from today, and most days where a strong trend develops intraday the moving averages can be used routinely and successfully in this fashion.

Organization of material over several Blogs... and the CMI


In the Links column to the right hand side you will see Titles to other blogs which I have organized and posted material I have written, along with other sites.

The Blogs I have written and materials I have developed have an asterisk * before their title.

I encourage you to visit all the referenced sites, at your leisure.

My study of CMI is ending its first week with 4 out of 4 days correctly predicted. An Extremely small sample, nevertheless, I will be releasing some details on this over the next couple of weeks for traders to beta test and hopefully they can share their opinions and results also.

CMI stands for Critical Mass Index and is roughly calculated by using the significant news related to a market or security from the recent past. To quantify it somewhat I have decided to give these individual news or fundamental items such as earnings or government reports etc, a weight or importance of 1-3 and a value of -3 to +3.

In this first week I have found it somewhat effective to assign a weight of 1 to any item that produces a move in the market less than 1 full standard deviation. In the case of YM this week that was any item that the YM moved less than 25 points. A weight of 2 was assigned for 25-35 and anything above 35 was weighted with a 3 or very important. Then the movement of YM was measured (discounting any knee jerk which simply retraced instantly) until the obvious momentum from that release was initially exhausted, many times occuring within the first 20 minutes.

That is a rough estimate of how I have been looking at it and I am sure it will be further refined as I get a larger sample and get feedback from others.

This index is also intended to make a trader think about and notice the effects of various items relating to what he is trading outside of pure technical analysis and to train him to better weigh and assign more correct values to these fundamental/news items and improve his trading thereby.

Good luck.

Friday, July 22, 2005

Unusual Events


Law of truly large numbers (coincidences) :
"That a particular specified event or coincidence will occur is very unlikely. That some astonishing unspecified events will occur is certain. That is why remarkable coincidences are noted in hindsight, not predicted with foresight."
--David G. Myers


In developing an approach to making money trading you need to consider rare events which impact the market or security you trade or which in an extremely rare event could do so.

A stock which is halted or an entire market which trades limit down or up while you eat a snack in the next room could ruin your trading day, week or career, if not planned for. To plan for such you need to have some appreciation for the mathematics involved and the statistical probabilities.

A good example of the term standard deviation as an introduction to probabilities is given in the article on this web site: http://www.robertniles.com/stats/stdev.shtml I suggest reading that article.

"One standard deviation away from the mean in either direction on the horizontal axis (the red area on the above graph) accounts for somewhere around 68 percent of the people in this group. Two standard deviations away from the mean (the red and green areas) account for roughly 95 percent of the people. And three standard deviations (the red, green and blue areas) account for about 99 percent of the people."

A glossary of Statistical Terms is to be found here: http://www.stats.gla.ac.uk/steps/glossary/probability.html

In practical terms a rare event which falls outside of the usual expected news or influence on the market may happen more often than traders plan for or have adequate solutions to as evidenced by the fact of failure of most day traders and many experienced traders working for large firms or hedge funds. Brillance in theory and approach while leaving out the detailed plan for an unexpected disaster relating to the security may lead to a personal or trading disaster for the trader.

In doing such a plan as to how you might handle an unusual event (outside of the second deviation and/or third) look for examples where such disasters have occured in the past and be prepared to execute a trading solution to the situation that will be within your means and resources.

Part of dealing with the fundamental value of a security or market is the anticipation of each possible outcome of trades taken. Do everything possible to safeguard yourself from a major loss due to a singular or highly rare event.


News and trend reversals and price spikes


(Originally written in 2003)


Sudden spikes or reversals often are the result of a rumor or news.

Today after the market had sold off initially and was slowly consolidating near its low it spiked up suddenly.

A piece of news that the Department of Homeland Security was considering lowering the terrorism threat level (somewhat earlier than expected by the mainstream press) came out and was then shortly thereafter discussed on a common trading news site : Briefing.com.

In many of these cases you get a reaction that is in stages. You get a strong push up followed by 1 or two further pushes as the news gets more and more broadly known.

In the case where it is a rumor, a denial of the rumor by an official or credible source also widely disseminated will often result in either a quick reversal in the other direction or no further spike.

News tends to move the markets in three spikes, rumors that become verified do also as more and more participants buy or sell the information. Finally a false rumor or false news reaction will stall or return to the original levels it traded at before the rumor became circulated.

Fundamentals Quantified


If you were to simply chart using two criteria all the economic releases during weeks leading up to your current week you would possibly find an interesting chart on Fundamentals that relate to the market. (The two criteria would be if the number had been positive or negative and if it had exceeded or missed consensus expectations)

Additional charting could be done and often is done on individual economic releases such as unemployment claims or consumer confidence, etc. This would give you a possible edge in anticipating market direction or even using one chart to predict another thus having a more predictable environment on market moving events.

Those of you who have noticed leading indicators from one release towards another should comment in response.

I will put some charts together on this soon and post what I find if I find any helpful correlations.

One url which has some information is: http://www.market-harmonics.com/free-charts/sentiment/consumer_confidence.htm

Friday, July 15, 2005

Critical Mass


"critical mass:

"An amount or level needed for a specific result or new action to occur."

In measuring market reaction to news it would help to know what the minimum impact on the market would be for it to move at all, and what would be the maximum impact a news item of any sort would make on the market.

This is true of a stock, option or futures contract and anything you could trade.


"In physics, the amount of material that must be present before a chain reaction can sustain itself."

You would want to know how much impact on the market and what type of event would create a critical mass and thus a chain reaction of buyers and sellers, some reaction which gains a wider spread attention and moves the traded security beyond its normal limits.

"The amount of matter needed to generate sufficient gravitational force to halt the current expansion of the universe."

You would also have some interest in what kind of drag on this market exists and which may counteract the critical mass of news that existed prior to the expansion of price, thus ending the expansion and triggering it to return to previous levels.

A calculation could be made based on probabilities and a bell curve - what kind of event and how much impact and weight must a news or fundamental item have in order to escape contraction of price. You could do a study of such fundamental items as routinely are released or cause the expansion or contraction of the security.

It is my belief this could be quantified and made into a strong predictor of price action.

Thursday, July 14, 2005

The destiny of souls


People eventually end up where they have been headed and where they have been putting their energy towards and how they shaped themselves.


The success of any trading plan is totally in the hands of the trader who develops and uses it.

As regards your trading plan and results "Do not send for whom the bell tolls, it tolls for thee"

Sunday, July 10, 2005

Turbulence


Turbulence in the market consists of conflicts in the underlying fundamentals.

The worse the turbulence the less effect a "normal" news item about the market or a security will matter, the less effect it will have on it's direction and momentum.

An overwhelming piece of news creates a sort of wave or turbulent effect which has to die down or run its course before any others news can be seen to have an effect on trading or price.

A quiet market shows the least effect visibly.

Saturday, July 09, 2005

"THE STORY"


* * *
U.S. employers added 146,000 jobs to nonfarm payrolls in June and hiring in the previous two months was revised higher by a net 44,000 jobs. The unemployment rate fell to 5%.
Economists React | Full report


* * *

This is an example of a "Story" that occurs in the general market. If this is the most prominent story that is having an effect on stock and futures prices for the time period you are trading in it is a good thing to know about it and give it weight in your trading.

Appearing in the on line version of the Wall Street Journal this story was a main headline story as the news broke.

To gauge the effect of a story it can be viewed against security prices - how much momentum exists after it comes out and a good momentum indicator will show when this momentum has been exhausted. When you get lessened volume on uptrends and classic momentum divergences on indicators it could be safely viewed that this story is no longer acting in the market as "THE STORY".

Trading story lines is not popular amongst technical traders, but it does provide a bit of a relief from a total lack of attention to market fundamentals while using the technicals to assist measuring the actual effect and duration of the fundamental news story about that security.

A little bit of balance is not a bad thing. In my opinion.

Introductory posting


I will be posting various thoughts opinions and trades in the Futures market here in this blog.

I have found this encourages me to clarify and make simpler and more effective my trading plan and allows me to share ideas with other traders I have met, know or have contact with on the net.

I am not really interested in any critical postings or someone who drops by and wants to have contrary opinions... they can start and run their own blog. So while I will gladly answer questions via email or in chats, I am not running a debate, just a blog.