Wednesday, January 25, 2006

ER2 1 minute Close vs volume, 4 days gap present


ER2 shows highest volume on a breakout bar just before 2pm today.
There appears to be a lack of volume of closes at price or gap to fill in in this price range.
Whether it does or not we can check back on later. Look for the area to be S/R.

Saturday, January 21, 2006

ER2 Intraday chart


Today's action on ER2 is common on trend days.

Note the price and volume as relates to the 144sma line and the upper and lower BBs.

Some other references:

(Missing from the blog for some reason is the moving average fan entry, which I will repost soon and which explains better how to view a trend day and trade it better.) Suffice to say These Simple Moving Averages and Bollinger bands make for some interesting set ups whether you are trading with the trend as you likely would be on a day like today, or are counter trend trading.

http://trend1.blogspot.com/2005/07/story.html

http://trend1.blogspot.com/2005/08/how-to-determine-trend-day.html

http://trend1.blogspot.com/2005/07/critical-mass.html

http://trend1.blogspot.com/2005/09/postulating-cause-without-proof.html

Monday, January 16, 2006

ER2 Time vs Close 10-13 jan -- 1 minute chart


This chart is possibly too few data points to draw a conclusion from.
I will post several more of this comparison. At the high end of the range 930 am around 1pm and around closing are the higher price points. The lower prices are uniform after an initial run up. Obvious support during this time period was around 708-709.

Sunday, January 15, 2006

ER2 Vol vs Close, 1 minute, 13 January


This includes several days of ER2 and indicates that volume limits on it are similar to YM with 2k contracts in 1 minute being right at S/R levels.

Friday, January 13, 2006

WAITING, for the love of God


Waiting well is an art form.

Ever get exasperated waiting? Maybe you need to picture something worth waiting for, or get in a better line.

Afraid if you wait any longer you will end up in a mess?


Is your chart telling you something and your mind looks like this:


Maybe you need to wait a bit longer. Trading is 95% or more waiting. Practice it. It can even be done once you already have a position.

A Drill to improve your ability to wait:

1) Go find a line and figure out what the fuss is about.

2) Find a security that it would be better to wait before you bought it. Wait.

3) Forget about the security and find another one that you are not ready to buy yet. Wait.

4) Think of something you can usually get without waiting and go get it.

5) If you aren't retired, think about how long it will be till you retire. Decide when you might want to do that, if ever. Decide to wait until then to retire, then start to wait.

6) If you are already retired, decide to wait a bit longer before you die, and wait. Decide to do something you enjoy and go do it without waiting.

7) Look at a stock chart and decide when the best buy would be. Don't buy it now, wait.

8. After buying decide when the best time to sell would be. Wait for that time and don't sell it until then. Use a stop loss or money management in case the price moves against you.

9. Reward yourself with a drink of something you like for finishing these steps, without waiting.

Tuesday, January 10, 2006

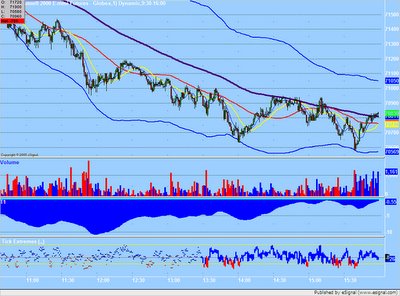
The 144 2.8 BB, top, bottom and mid band trades


I bought the higher low after the bounce off the lower BB(at 11022).

This was a relatively high risk trade as selling pressure may not have been off completely.

It worked well time wise with the "315" or bonds close dip trade.

It worked out and I sold for +30.