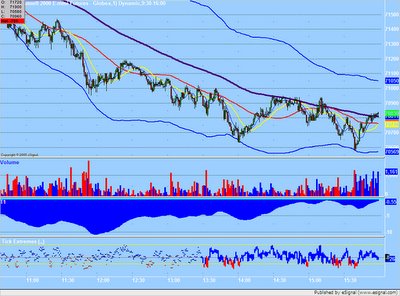
Today's action on ER2 is common on trend days.
Note the price and volume as relates to the 144sma line and the upper and lower BBs.
Some other references:
(Missing from the blog for some reason is the moving average fan entry, which I will repost soon and which explains better how to view a trend day and trade it better.) Suffice to say These Simple Moving Averages and Bollinger bands make for some interesting set ups whether you are trading with the trend as you likely would be on a day like today, or are counter trend trading.
http://trend1.blogspot.com/2005/07/story.html
http://trend1.blogspot.com/2005/08/how-to-determine-trend-day.html
http://trend1.blogspot.com/2005/07/critical-mass.html
http://trend1.blogspot.com/2005/09/postulating-cause-without-proof.html