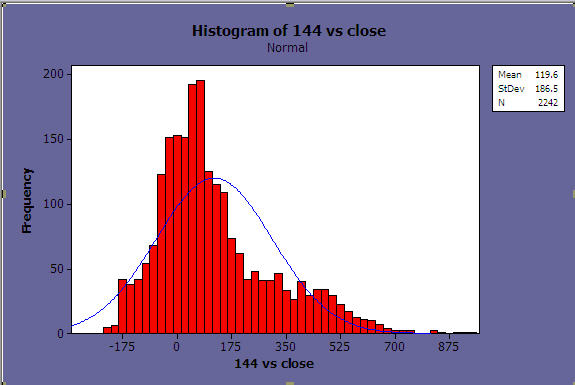
This shows just how badly skewed towards selling the market has been the last 4 days.
The negative values represent how far under the closing price the 144 sma is for each minute during regular trading hours the last 4 days. It gives a good idea how extreme the difference can get at the right end of the distribution (around 9 or 10)