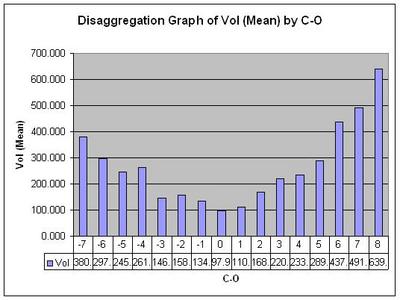
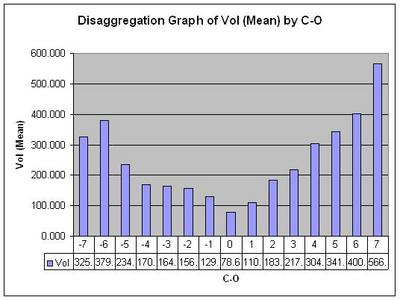
Saturday, December 17, 2005
DIstractions
In Trading it is important to limit distractions.
Some traders generate their own, or allow themselves to be put in a position to be constantly distracted.
An easy way to determine who is successful is to look or listen for distracting behavior or talk from a trader.
When you are not trading it doesn't matter what you juggle. While you are trading it's a good idea to eliminate anything that doesn't contribute to your execution of your trading plan.
Friday, December 09, 2005
Sunday, November 20, 2005
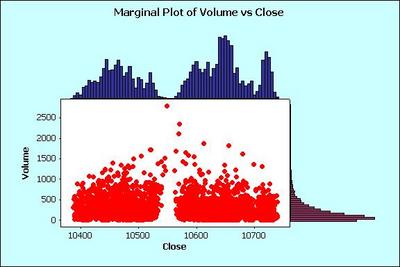
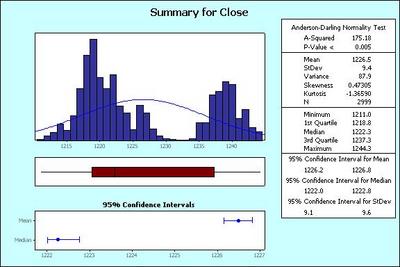
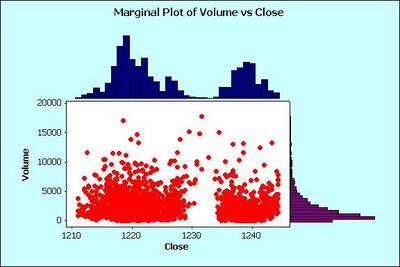
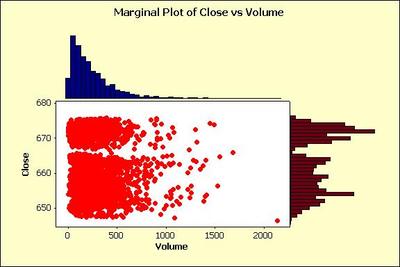
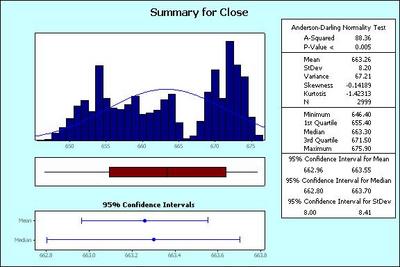
Marginal Plot YM 1 minute Volume and Price
Friday, September 30, 2005
All the difference in the world
Example of predicting the future:
The Yankees will win the pennant because they have won it so many times before.
Example of observing an occurance to see what would be expected to happen in the immediate future:
A snowstorm is headed for New York and could be expected to be white in nature and wet.
A magic 8 ball and its prediction for todays market ahead of time...
Gargoyles, Vampire blood preserved in vials, werewolves, frankenstein monsters, sea monsters, the flat earth, lunar eclipses "caused" by village witch doctors...
The Master race, the flat earth, green cheese and the man on the moon.
( http://www.planetfusion.co.uk/~pignut/cheese.html )
Martians (speaking of green men) invading. Global cooling, global warming, god is on America's side....
You can't fight city hall. Individuals can't change things. Might is right.
Man is the center of the universe. Earth is the center of the universe. Witches float and don't drown when you throw them in the river, so you should burn them at the stake.
69 virgins will greet those who kill for their god.
People will believe the craziest things.
When someone tells you he knows how the market will react in the future, add that to this list.
We don't get french benefits, but Fed Ex is too expensive.
Being Right about everything!
An Exercise to try:
1. On a simulation mode randomly decide to enter a position, by flipping a coin.
Heads for long, tails for short.
2. Enter that trade, deciding that you are right according to your decision to enter the trade.
3. If the position goes against you wait for 5 minutes and then add to your losing position.
4. Repeat #3 3 times as needed.
Next:
2a. If the position goes in your direction decide you were brillant in your entry and take a profit as soon as you can.
3a. Wait until any trend seems over then again enter the same position, once again deciding on the brillance of your reasoning.
4a. Take any profit that you can immediately get and brag to someone about it.
5. If the new position shows a loss repeat 3 and 4 above.
If possible take a note of what your total gains and or losses are.
Repeat this exercise until you feel no need to:
a) Immediately exit your entire position in a winning trade.
b) add to losers
c) brag about your brilliant methods
d) be right about every trade.
Thursday, September 29, 2005
The Moving Average Fan
A moving average fan is a set of different lengths of moving averages placed on the same chart.
Ideally this is composed of a set of widely followed moving averages which provide support and resistance.A very strong new trend for instance on my set of moving averages, stays on one side of the 8 period simple moving average, then as it weakens or gets more mature and the buying (or selling in a bearish trend) weakens it loses this as a support/resistance line.
Then it often goes to the next higher moving average and may once again often resume the original trend. This continues often in the set of moving averages that I use: 8,20,50, 89, 144 and sometimes 200. Visually this seems to show a fan spreading out at the beginning of a strong trend and contracting again as it weakens. As a trend reverses the fan has usually been pushed back together and reverses direction and once again opens up, with the moving averages each been violated as previous trend supports.
So as a new trend is established the 144 period or 200 period moving average is now below the price and acting as support. An aggressive trade on this may be to counter trend trade each of the moderately long moving averages once violated, in hopes of getting a better entry. Be aware however that the trend is usually effectively in place until the longer moving averages act as support.
You could picture this as a fan opening and closing, or as STEPS, each more significant in relationship to the trend continuing or a reversal occurring.
Daily Trading Review
A method to quickly review and correct errors so they do not repeat or continue to affect the traders results is being made available here.It can be done by the trader by himself or as stated by another trader willing to help which is what I would recommend for the best result.This review can also be done simply as a trade by trade review of each trade during the day starting from the beginning and skipping trades that were unremarkable. A log of trades and some good memory or written or recorded notes as to the reasons why trades were entered or exited is helpful in this kind of review and correction.
Peer Review: Trader CorrectionThis procedure is to be followed:
1) Establish winning and losing trades for the day.
2) Throw out all trades with minor gains or break even.
3) Take the first losing trade of the day and determine:
a) The set-up and trigger for the trade and entry price, exit and stop.
b) What happened that was unexpected including any news.
c) Whether or not the set up actually existed prior to entry and the reason for the exit.
d) If no set up existed or the exit was incorrect determine what occurred prior to the entry or exit which confused the trader.
e) Determine what was the actual situation at that time.
f) Have the trader review what he would now do and why.
g) If the trader feels he has learned something and is cheerful on the subject of having corrected his error – end the review of this point and as needed have him correct his trading plan to avoid making this same error.
h) Determine if the same error led to other losing trades later in the day and quickly note such without further correction.
i) Go to the next losing trade of the day and repeat a-h.
4) Take the first winning trade of the day which was substantial and determine:
a) What was the set-up and trigger for entry and when was profit taken.
b) Determine if the strategy the trader was using was fully applied.
c) If so, congratulate the trader on his profits.
d) If not, determine if there was a disagreement that the trader had about the strategy, or a disagreement of some sort with it.
e) Find out when this disagreement first occurred and have the trader tell you his thoughts on the strategy.
f) If the strategy itself is flawed, have it corrected on the trading plan.
g) If the trader misapplied or misunderstood the strategy carefully work out what confusion he has with it by walking him through the trade and finding out when the confusion first occurred. Look prior to that point for any variable which distracted the trader or made him feel like he could not execute the strategy.
h) Clear up the reason for that confusion and drill as needed future application of the valid strategy.
5. Watch for any extreme emotional reactions to specific trades and ensure that if such occur steps are taken to get the trader to relax and concentrate on the peer review.
6. No trader critical approach is to be communicated. The trader himself is not allowed by peer to shrug it off with self effacing attitudes. Once a review is started, no further trading is done until it is completed, on the strategy involved.
7. When the trader and peer reviewer are both satisfied that the cause of poor trades and poorly executed trades has been determined and are both HAPPY to have corrected any errors in trading or strategies this peer review is ended.
Tuesday, September 27, 2005
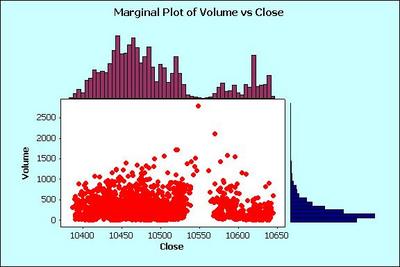
YM from 8 Sept Dec 05 contract 1 minute close vs vol plot
Monday, September 26, 2005
Civility
While life holds more than a few opportunities for joking around and kidding, usually this is done in a situation where a good degree of social grace already exists.
Chats rooms can be distracting to an extreme to those trying to run them if the participants are fighting or purposefully insulting each other.
A definition may apply: (from Dictionary.com)
civility
n 1: formal or perfunctory politeness [ant: incivility] 2: the act of showing regard for others [syn: politeness]
So while a certain amount of joking and an informal attitude may exist in a chat channel, please be advised that either #1 or #2 above need to be shown by chat participants at least during market hours, and that remarks aimed at others intended for the sole purpose of showing disregard will result in a ban from any channel I am running, for a period of the rest of the trading day.
Joking is certainly permitted but mean spirited insults and disregard are not.
Those who repeat such remarks will be banned on a permanent basis.
Positive discussion is encouraged.
Sunday, September 25, 2005
Postulating a cause without proof
The beginning of the Scientific method, if I recall correctly is to postulate a phenomenon or a set of related circumstances and their cause.
Without Proof almost anything can be decided upon.
In this case the postulate would be in math formula style:
C^x = P^x
where
C = A rational and correctly figured CMI
x= the standard deviation (1-4)
P= Price
So if CMI is figured in such a way that its raw total falls within a particular deviation of CMI numbers then the price of the security should correspond.
A quick example would be if CMI was 9 and this was in the 3rd standard deviation then the price of the security would in this case be found to have varied or moved from the time of the beginning of the calculation until its conclusion - positively three standard deviations.
If the third standard deviation is 100 points or more then a CMI reading at 9 would indicate a movement in the index or security of 100 or more.
If such a CMI calculation were not to result in such a movement this theory would be able to shown to be false for that calculation but not all such calculations. In such a case a different calculation as to CMI would be tried.
Can it be proven positively that this formula is correct?
Thursday, September 22, 2005
Plot of Vol and Closing 1 minute price back to Sept 7
Shown with a little longer time frame very high Volume bars (VHVB) - are present at extremes of the mid term range, or at breakdown or breakouts. This chart represents over 5000 bars and gives a little longer and different view than many of the previous ones.
While it is more likely than not that a high volume bar indicates a reversal a stop as previously described on this blog would be in order. You would do better to buy after the support held or breakout was verified or support broke. The rare occasion a VHVB does not indicate and result in a reversal it signaled a breakdown on this chart. A reversal in position or stop and reverse is not usually a good idea but this might prove to be the exception.
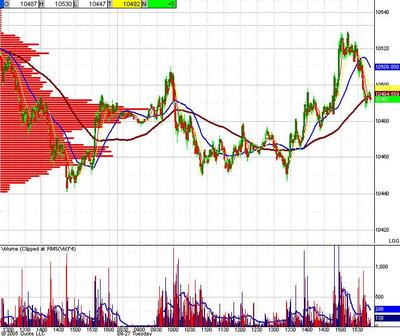
YM 1 minute chart with VAP
Wednesday, September 21, 2005
The First Thing
What is the most basic thing about the market today?
What is the simplest question that once answered would sum up the market today?
Instead of preparing for the trading day with the indicators, pivot points, news stories and then trying to weigh each one - can you sum it up with the answer to a simple question?
What is the first thing that needs to be known about this market today?
Monday, September 19, 2005
Manipulation
The appearence of fair play must be held out by authorities who cannot simply state that no matter what they have attempted to do markets remain manipulated and are grossly slanted against any individual trader.
One of the tools of a market manipulator is Propaganda. Propaganda can range from facts which are embellished by placing them out of context, such as many P/E ratios are, to Deliberate lies told to foward a planned deception on a broad basis.
Merrill Lynch was caught with their pants down on the subject when e-mails from their "analysts" flatly stated that recommendations they made were not true, that in fact the recommendations were based only for the purpose of obtaining other business.
In such a case the entire facade of stock analyst was exposed to show what really existed and the false propaganda temporarily was shattered. Like the wizard of Oz, regulators and the Investment Banks were quick to pull the curtain back lest the whole system collapse from the weight of truth.
When manipulation is obviously occuring it would be an interesting study to see how far the manipulation goes and the extent of the facade.
The emerald city may exist, but the grand and mighty Oz may be just a projection and without the illusion getting in the way it may be easier to "get home".
Wouldn't it be foolish to believe that the system which allowed World Com to exist and Enron and the rest of the public scandals of the last several years did not in some way work to prop up such fraud and misbehavior?
How do the broadly accepted standards for investing stack up against the manipulation which is occuring? Does Technical analysis work broadly as if it were a scientific subject?
Does Fundamental Analysis give a false sense of comfort to the masses who have their life savings or pension funds tied up in investments?
If manipulation is built into the system can an individual trader learn to benefit from it or consistently know the truth of the situation?
What tools exist for a trader that might allow him to flourish in the face of any widescale or systemic fraud?
The first step in answering most questions is to ask them.
Sunday, September 18, 2005
Propaganda
Propaganda is defined in the encyclopedia Britannica as:
Manipulation of information to influence public opinion.
The term comes from Congregatio de Propaganda Fide (Congregation for the Propagation of the Faith), a missionary organization established by the pope in 1622. Propagandists emphasize the elements of information that support their position and deemphasize or exclude those that do not. Misleading statements and even lies may be used to create the desired effect in the public audience. Lobbying, advertising, and missionary activity are all forms of propaganda, but the term is most commonly used in the political arena. Prior to the 20th century, pictures and the written media were the principal instruments of propaganda; radio, television, motion pictures, and the Internet later joined their ranks. Authoritarian and totalitarian regimes use propaganda to win and keep the support of the populace. In wartime, propaganda directed by a country at its own civilian population and military forces can boost morale; propaganda aimed at the enemy is an element of psychological warfare.
Now I'm not saying that some part of or much of the market is being represented in a manner that would qualify it as propaganda, but propaganda certainly is used by all sorts of vested interests in life, why should the market, or various services connected to the market be exempt from such.
The proponents of Companies, or those pushing methods of valuation could possibly be trying to influence the broad public or any number of minor or niche publics with propaganda.
When a whole area of life or subject doesn't seem to produce results or isn't uniformly workable a person could rightly suspect that propaganda and not facts have led to that subjects ineffectiveness. It might take some digging to get to the bottom of the reason or reasons why such is the case.
Thursday, September 15, 2005
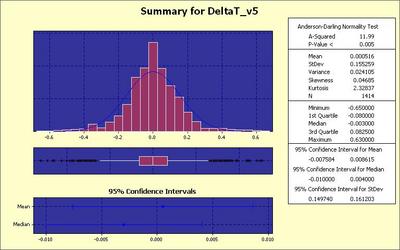
DeltaT - a decent momentum indicator, Ym 1 minute distribution
Ym 15 Sept 1 minute Plot Volume and Closing price (4 days data)
Wednesday, September 14, 2005
13 Sept YM Close vs Vol 1 minute 3 days data
Tuesday, September 13, 2005
Statistics and sex
Statistics aren't always the most exciting or easily understandable thing you can find on the net or in relationship to trading.
You can't spend your life on the beach with the playmate of your dreams or anyone else for that matter, sipping a drink, without some dedication to the discipline of being successful at something else first.
If trading is a hobby, for you, then skip any thorough examination of statistics, they are not really fun...
If trading is something you would like to know more about than your average trader, it likely will be necessary to understand probabilities and all the rest....
For that matter what are the possibilities of ending up on the beach with the girl in the yellow bikini?
YM Price High minus Low vs TICK High minus low 1 minute chart (2 days data)
Kind of Esoteric, but the concentration of lower volatility bars is around the concentration of the lower volatility of $TICK.
The outliers and extremes to the right upper and lower sections of the chart could help identify when you have a rare instance of high volatility on both.
This would have to be looked at vs a candlestick chart to see if it normally indicated a reversal or further trend, but it would likely be the top of volatility when both are very extreme.
YM 1 minute summary of High minus Closing price 2 days data
Monday, September 12, 2005
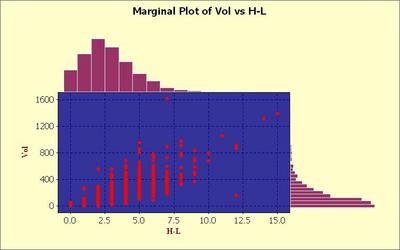
Marginal Plot of Volume and High minus Low YM 1 minute 2 days
Volume (mean) by closing price Ym 1 minute 2 days data
Marginal Plot of Close and Volume YM 1 minute 2 days
Marginal Plot of Close and $TICK YM 1 minute 2 days
Sunday, September 11, 2005
Closing Price minus Opening Price, Frequency YM 1 minute
Plot of YM 9 Sept only Close-Open price 1 minute
Marginal Plot Ym 9 Sept 4 days 1 minute closing data
A picture of a trending market...
Notice the extremely high volume points and where each of these are located on the plot.
From day to day the high volume changes in a trend as far as where it might be, with a top one day being a lower point the next.
Also I see no blow off type of volume although this may be affected by the contract rollover..