Wednesday, May 31, 2006

Who's painting what?


In any examples of trades given on this blog I am not trying to limit you to viewing your own trading to ONLY what is noted by me.

In fact several factors should determine every trade. You should have the trade cornered by having the most angles possible covered.

I am obviously not a professional trading advisor etc, and all blog posts are strictly for informational purposes only and are only intended to be a statement of my personal opinion.

What I mean by painting a trade into a corner is to leave it no way out but how you intend, as much as is practical.

Combining statistical analysis with current technical charts and patterns, fundamental information and risk control are all part of getting the most gains possible from your trading.

Taking one trade after the other that is a 50% chance with equal target and stop losses is a sure loser with slippage.

Example:

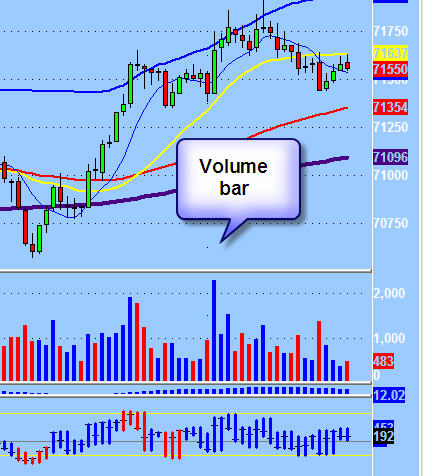
Take a trade on an impulse because of a volume spike, hold it despite the spike not holding price or not resulting in a winning trade, deciding you like it for longer term, after glancing at the 60 minute chart.

Here is the graphic of that trade:


Now obviously painting the trade into a corner would run more like this: By using all the information to hand include breadth and momentum indicators, charting patterns, news, other fundamentals, other market influences such as oil or commodities or currencies, volume, and correct leverage and risk control, and any other usual aide to trading covered in a trading plan you have tested.

Don't paint yourself into a corner with an incomplete strategy and trading plan, or impulsive trading.

Wednesday, May 24, 2006

ER2 Volume Bar


Volume bars signify breakouts or reversals, but often with a little follow up regardless, making for a scalp in the direction of the trend.

Monday, May 22, 2006

Wednesday, May 17, 2006

sisters at 3 weeks

 Posted by Picasa

3 weeks old

 Posted by Picasa

Tuesday, May 16, 2006

BB trading range trades


Buy at 144 on open, sell the rally failure at the upper BB, buy the lower bb, sell the upper etc,
likely to end the day around the midpoint of the 144-1sma 2.8 stand dev...

Monday, May 15, 2006

Drills To overuse, again and again till you can do the actions involved in your sleep and without fail


Putting together Blogs which explain specific practice drills to help traders become Traders:

http://trend1.blogspot.com/2006/01/waiting-for-love-of-god.html
http://trend1.blogspot.com/2005/09/first-thing.html
http://trend1.blogspot.com/2005/09/what-is-simple-about-these.html
http://trend1.blogspot.com/2005/09/daily-trading-review.html
http://trend1.blogspot.com/2005/09/being-right-about-everything-exercise.html
http://trend1.blogspot.com/2005/08/anticipation.html
http://trend1.blogspot.com/2005/08/ubiquitous-and-obligatory-10-rules.html
http://trend1.blogspot.com/2005/08/signals-time-intervals.html
http://trend1.blogspot.com/2005/08/breaking-it-down-into-smaller-parts.html
http://trend1.blogspot.com/2005/08/vital-role-of-repetition-in.html

Where the drill isn't explicitly stated it is still intended that you walk through or DO the action indicated in the blog.

Evolution of Math in America?


Last week I purchased a burger and fries at McDonalds for $3.58. The counter girl took my $4.00 and I pulled 8 cents from my pocket and gave it to her. She stood there, holding the nickel and 3 pennies. While looking at the screen on her register, I sensed her discomfort and tried to tell her to just give me two quarters, but she hailed the manager for help. While he tried to explain the transaction to her, she stood there and cried.

Why do I tell you this? Because of the evolution in teaching math since the 1950s......

Teaching Math In 1950: logger sells a truckload of lumber for $100. His cost of production is 4/5 of the price. What is his profit?

Teaching Math In 1960: logger sells a truckload of lumber for $100. His cost of production is 4/5 of the price, or $80. What is his profit?

Teaching Math In 1970: logger sells a truckload of lumber for $100. His cost of production is $80. Did he make a profit?

Teaching Math In 1980: logger sells a truckload of lumber for $100. His cost of production is $80 and his profit is $20 Your assignment: Underline the number 20.

Teaching Math In 1990: logger cuts down a beautiful forest because he is selfish and inconsiderate and cares nothing for the habitat of animals or the preservation of our woodlands. He does this so he can make a profit of $20. What do you think of this way of making a living? Topic for class participation after answ ering the question: How did the birds and squirrels feel as the logger cut down their homes? (There are no wrong answers.)

Teaching Math In 2006: Un ranchero vende una carretera de maderapara $100. El cuesto de la produccion era $80. Cuantos tortillas se puede comprar?

Friday, May 12, 2006

ER2 1 minute Close vs volume, 4 days gap present


This distribution would indicate a gap that should fill when strength is next shown, up to around 760.

The Negative distribution of ER2 closes vs the 144 1 minute, the last 4 market days since the market top


This shows just how badly skewed towards selling the market has been the last 4 days.
The negative values represent how far under the closing price the 144 sma is for each minute during regular trading hours the last 4 days. It gives a good idea how extreme the difference can get at the right end of the distribution (around 9 or 10)

Wednesday, May 10, 2006

Orders of magnitude, Time distributions, random perspectives


Orders of magnitude confront or evade our conception and understanding on a constant basis.

In Physics an attempt is made to conceptualize a order of magnitude many times smaller than our usual life experience. Such attempts have led in one fashion or another to the computing revolution of the last half of the last century and up till today. Also attempts have been made to understand the universe in it's entirety and from beginning to present.


Neither of these attempts however would be easily grasped by a normal person caught up in day to day life, without serious study, and thought.

An order of magnitude can consist of volume or time frame or speed or many things considered in trading or life by traders.

Where a trader gets an edge on others is in his choice and USE of an order of magnitude, having greater understanding of his market over time or insight into the ins and outs of the speed of his market or even volume connected to it.

In life an order of magnitude must be self aware to be useful. Albert Einstein is quoted as saying the same level of awareness which generates a problem cannot solve it, or possibly the same order of magnitude.

Similes abound. You can't see the forest for the trees, look at the big picture, penny wise and pound foolish, etc.

In developing a trading plan be sure to consider the order of magnitude of each aspect of it that you use. Be sure that using that time frame, or indciator or market or leverage work together and don't clash with each other or your own competence and understanding.

Just as a trader wishes to be exceptional, he must also have exceptional understanding of his approach and his edge be beyond a usual distribution of those in the market to obtain truely exceptional results.

Don't expect to split the atom with a knife or see the farthest reaches of the universe with a magnifying glass.

Friday, May 05, 2006

ER2 Vol vs close graphic


Two outliers high volume points mark solid and more recent s/r.

It looks a bit like a gap to fill down to around 778, and I would expect that to be an area of consolidation at some point.

In general ER2 being at an all time High, there is no climax in volume at the upper end and so no real cap exists on it as of now, looking at it from only the viewpoint of volume and close.

Thursday, May 04, 2006

A first attempt at a fundamental profile using excel charting


If S1-S5 were data sets meant to represent market fundamental events such as earnings or news and horizontal 1-6 indicated a scale of bullishness with 1 being very bearish and 6 being very bullish, and vertical 1-6 being values of different events in volume and effect such as is described in earlier articles in this blog on CMI, then this would show a mixed batch of news.

Such a graphic could hold numerous data for any security and give an ongoing picture of how fundamentals or even technicals might influence price.

Above using somewhat random values shows a hypothetical security with a very bullish point and a balancing negative effect.

Someone should challenge this method by asking me to consider what they know affects a contract and have me draw up a chart of it.

Or I will come up with one myself, and see how it plays out.

I think this can be made to be useful for many different time frames.

Automatic drawing would require programming skills beyond my capability but might prove interesting. It could provide an ongoing graphic and total absolute value.

Continuing theory on Dynamic pricing of contracts and securities


This is an illustration of gravity, which could serve as a close analogy to market impact of news and fundamentals.

If one news item is dominant in the current market or relating to the contract or security the visualization of effect would look something like the above.

If more than one existed depending on the weight of the item other pulls on the price would exist. Timing of the release and effect on the market might be shown as follows:


You could draw a line which would indicate anything to the right of it would attract sellers anything to the left buyers, or graphically it could be plotted on a chart. Impacts weight and duration, expectancy, and other impacts come into play.