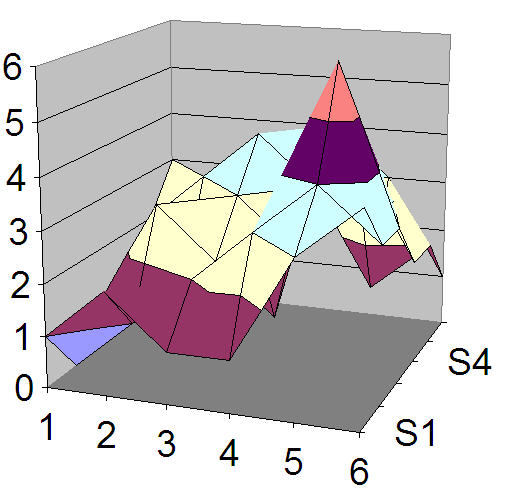
If S1-S5 were data sets meant to represent market fundamental events such as earnings or news and horizontal 1-6 indicated a scale of bullishness with 1 being very bearish and 6 being very bullish, and vertical 1-6 being values of different events in volume and effect such as is described in earlier articles in this blog on CMI, then this would show a mixed batch of news.
Such a graphic could hold numerous data for any security and give an ongoing picture of how fundamentals or even technicals might influence price.
Above using somewhat random values shows a hypothetical security with a very bullish point and a balancing negative effect.
Someone should challenge this method by asking me to consider what they know affects a contract and have me draw up a chart of it.
Or I will come up with one myself, and see how it plays out.
I think this can be made to be useful for many different time frames.
Automatic drawing would require programming skills beyond my capability but might prove interesting. It could provide an ongoing graphic and total absolute value.