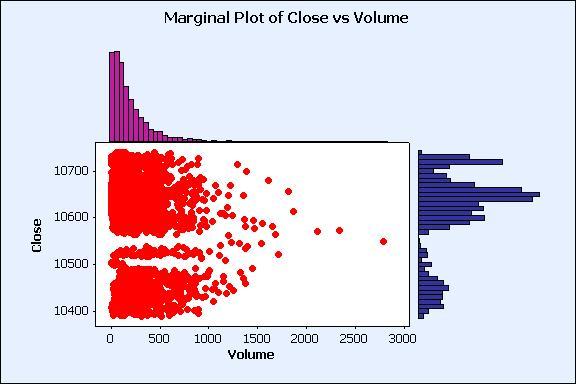
Shown with a little longer time frame very high Volume bars (VHVB) - are present at extremes of the mid term range, or at breakdown or breakouts. This chart represents over 5000 bars and gives a little longer and different view than many of the previous ones.
While it is more likely than not that a high volume bar indicates a reversal a stop as previously described on this blog would be in order. You would do better to buy after the support held or breakout was verified or support broke. The rare occasion a VHVB does not indicate and result in a reversal it signaled a breakdown on this chart. A reversal in position or stop and reverse is not usually a good idea but this might prove to be the exception.