
Reference: http://trend1.blogspot.com/2005/08/zero-sum.html
Something that may be worth taking a look at:
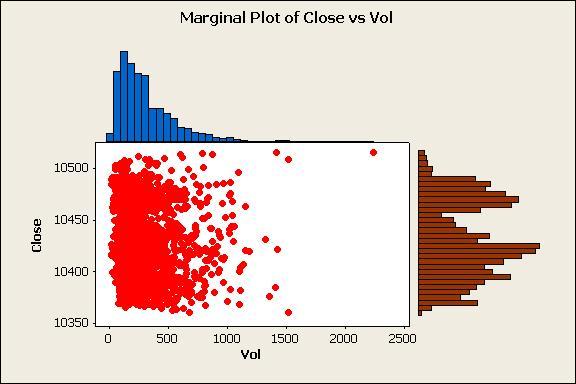
A day trading bollinger band setting such as the 144 period, 2.7 deviation with a volume barrier which shows recent extreme in prices and volume correlation along with a fundamental and statistical approach.
For instance the 10475 area has been a very frequent close on YM, and over the past several weeks 2000+ contracts on YM has marked highs and lows on the price.
A simple approach to fundamental valuation of the YM futures market as covered by any figuring of *CMI you may be comfortable with.
A negative CMI is likely to keep the price within the lower end of the range ( ie below 475) and a high one would be the circumstance that would lead to any rally once the price is above 475. A breakdown in price is not likely to occur in any case unless the price is below the 475 level and CMI is also negative.
At the recent extremes of price as shown on a distribution curve where a very high volume (+2000 or higher) is made on a 1 minute chart a reversal has occured and at the very least waiting on a momentum shift in the form of a lower high etc, would result in a very high probability trade, if given a proper stop.
* CMI is an index a trader can determine of those fundamental or news factors he sees which affect the overall market. Differing methods of calculating this are given in the following posts:
http://trend1.blogspot.com/2005/07/organization-of-material-over-several.html
http://trend1.blogspot.com/2005/07/fundamentals-quantified.html
http://trend1.blogspot.com/2005/07/critical-mass.html
http://trend1.blogspot.com/2005/07/story.html
http://trend1.blogspot.com/2005/08/news-and-market-sentiment.html