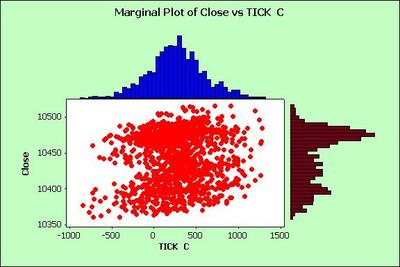
I notice a couple of interesting points on this chart.
1) The symmetrical distribution of the total $TICK periods.
2) The contraction of the volatility of $TICK between the extremes of price.
You may see other things also...
"For the first time he perceived that if you want to keep a secret you must also hide it from yourself." -George Orwell from "1984"