If a bullish indicator exists while a price is at resistance levels it has a greater chance of creating a loss for a trader than one which is generated at a support level. In managing risk therefore it would allow a trader to tighten up his stop loss buying the support rather than buying a tick above resistance or at resistance.
A chart of a sideways market is shown to help illustrate this.
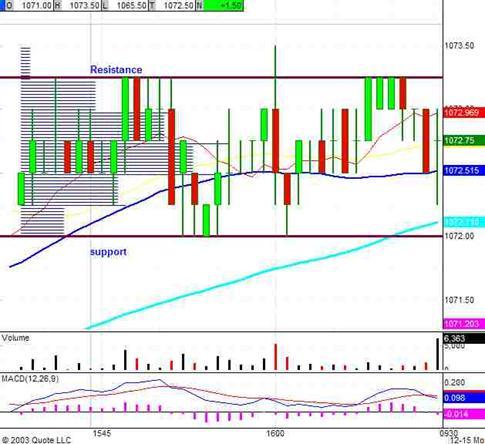

In a trending market very often the trend temporarily ceases to go straight up, this is a flag and very often the price action retraces to a level of previous resistance or support, which is now reversed in function.
Buying or selling such a flag increases profit potential and allows for smaller losses if the entry signal or trade loses.
This is a part of managing risk.
In the course of a bull trend developing it may have several flags which create a trend line support and several pushes which create resistance.
Buying the support on such increases the potential for gains and allows a tighter stop loss to be established.